It’s pretty rare to find someone that is both a great cook and a great baker. That’s because baking and cooking require two entirely different skillsets. Both share a similar goal of providing a tasty outcome, but how they approach that outcome differs. With baking, you mix all of your ingredients, throw it in the oven, and pray your dish comes out tasty. However, with cooking you have the opportunity to taste test and adjust a recipe as needed so you can get the best tasting dish possible.
Just like how baking and cooking differ, so do return on investment (ROI) and return on effort (ROE) calculations. Traditional ROI calculations, just like baking, can be slow, requiring expertise and precise measurements. Whereas ROE is similar to cooking, in that you can work with more agility, ‘taste test? as you go, get results faster, and adjust as needed. ROE provides content-level performance metrics that give your teams quick insights into not only how content is performing in market, but whether the effort and spend that went into creating the content was worth the effort.
Wouldn’t it be awesome if you and your team could be like the rare few that are great bakers and great cooks? Wouldn’t it be fantastic to see what’s working, and not working, while you’re working on it and benefit from precision and expert planning? Combining ROI and ROE gets you exactly that.
Why ROI Data Alone Isn’t Enough
The methods that most marketers are using today to calculate ROI often focus too heavily on vanity performance metrics such as views, likes, open rates, shares, etc. Those metrics place too large of an emphasis on engagement and don’t tell the depth and breadth of your much bigger content story. Vanity metrics don’t speak to the actual time, energy, and spend that went into producing content. And without having metrics that incorporate those factors, we aren’t equipped with the information we need to do things like:
? Deliver data-driven, fast answers about return on marketing spend/effort for executive teams
? Combine data- and creative-driven approaches to optimize design strategy
? Become more agile and focus resources on areas with high returns
These vanity metrics can easily tell you things like, ?We got 5,800 impressions on this piece of content!? But ROE data can dive deeper and tell you, ?This piece of content got 5,800 impressions, but it took us 120 hours to create and cost us $5200. Whereas this other piece of content got 3890 impressions but took far less hours to complete and get into market. It also only cost us $1,700?.

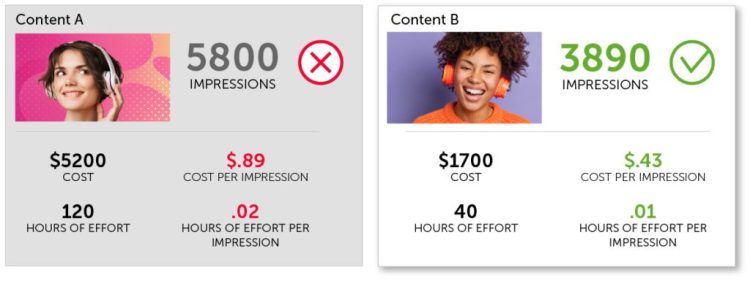
ROE data provides you with a holistic, more complete, set of data so that you can more confidently assess which content piece(s) are truly more successful and how to adjust spend and resources accordingly.
Calculating the ?E? of ROE
Displaying the number of impressions an asset has against the money spent producing it, and the hours of work that went into finalizing it, ROE shows users a cost per impression calculation that offers a simple, graspable leading indicator of how worthwhile that piece of content was to make and subsequently use in campaigns.
Aprimo captures information such as spend and work hours so that these calculations can be displayed in the DAM. You can also configure the DAM so that your data can be measured the way that makes the most sense for your organization.
Complement Your Existing Performance Tools
Aprimo natively captures impressions on DAM assets, and these impressions can be analyzed and viewed by campaign type, source, medium, or any other common analytics tracking parameters. You can easily see how much a particular asset costs to make, distribute, and the number of hours that went into creating it. This data provides you with a quick pulse check into things like “hours of effort per impression” and “cost per impression” so that you can better understand, compare, and form a baseline level of content performance.
However, Content ROE data doesn’t just live in isolation in the DAM. It can be funneled into and viewed in Salesforce Datorama, Google Analytics, and other marketing analytics and measurement tools so that you can view content data in the context of broader website, digital, and marketing program performance.
Unleash Omnichannel Potential with Content-Level Insights
Many of us have experienced baking disasters where we anxiously waited for our dish to finish cooking, only to find out we totally butchered a recipe. Unfortunately, this sort of fiasco has made its way from the kitchen into the board room. We?ve all been guilty of creating random acts of content’throwing it out there, and then waiting until the end of the quarter to measure if it made a ‘splash.? And with budgets continuing to shrink, demand continuing to rise, and resources getting more overworked, we don’t have time or money to waste.
With Aprimo’s content return on effort data, you can avoid guesswork or waiting for lengthy ROI calculations by getting an instant pulse check on how your content is performing. These content-level insights can allow you to better allocate your resources, optimize your content strategies, and confidently answer what we all want to know: ?was this worth the time and effort??
Want to learn more? Check out our Content ROE datasheet.