
Creating a useful and easily understandable dashboard to tell a content operations story takes a unique blend of scientific skill and artistic creativity. Both parts are equally important in order to convey the proper message to your users.
From a science standpoint, yes, it’s important to make sure the data is accessible, accurate, and includes information that actually answers a user’s question. Equally important is the ability to render that information so the user isn’t overwhelmed and can easily identify what they’re looking at and how it answers their question.
Building a content dashboard that easily and intuitively answers your user’s questions is an art. Whether you’re using Excel, PowerPoint, PowerBi, Tableau, or any other type of data visualization tool, these three tips will help you create a powerful, useful dashboard that your users love.
We won’t go into metrics here, because that’s a different discussion, but, right now, we’ll focus on three tips that will help you effectively design a dashboard to highlight content performance.
Not all dashboards serve your users
First, let’s take a look at a less than stellar example of a Content Performance Dashboard focused on Download Summary.
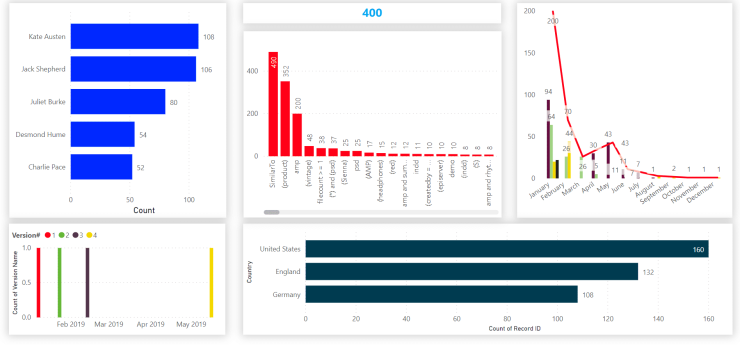 Example of a Content Download Summary Dashboard that’s difficult to parse.
That dashboard has a lot of information presented in a lot of different ways.
If I were a new user to this dashboard I would have no idea what this information was telling me unless I really studied it chart by chart and made some assumptions.
Aside from the purpose of each included chart it’s not entirely clear what the different colors mean (and is the red in one chart relevant to the red in another chart?), what exactly are all the numbers. If I hadn’t told you this was a Content Download Summary Dashboard what would you think?
Now let’s take a look on another version of the exact same data.
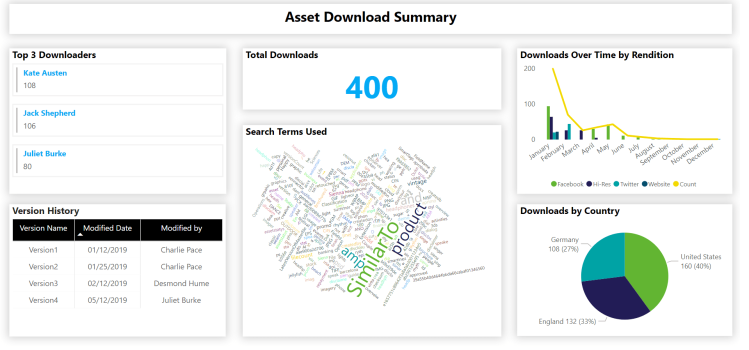 A clearer, more streamlined version of the previous dashboard.
The same data presented a different way can improve the usage of your dashboard by making it easy to understand the data at a glance. Any dashboard that isn’t easy for your user to understand probably needs help.
3 tips for better dashboards
Which brings us to some quick tips on making your dashboard more user friendly, make its data clearer, and increase usage of the dashboard overall.
1. Make it simple.
People can have pretty short attention spans when it comes to trying to read things quickly.
According to HubSpot, once a reader opens your email they will generally try from 2-8 seconds on average to determine what the email is about and if they’re interested.
Think of a dashboard in the same way?you want your users to understand its purpose quickly so they can then make a decision if they’re interested in the details. Some ways to do this include:
- Use titles when you can. Think of titles like the subject line of your email. They are there to be grab your user’s attention and convey the message in a succinct way.
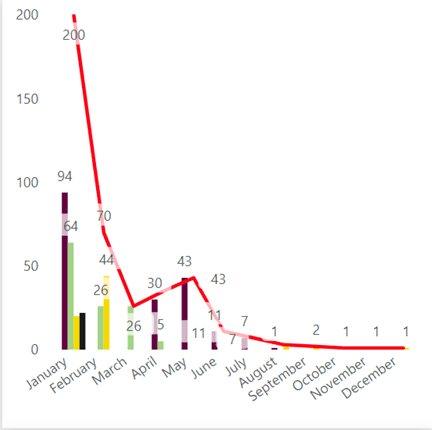
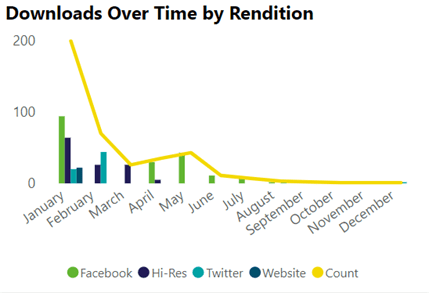
- Use data point labels OR axis labels (not both). Of course there are exceptions to every rule, but, in general, if you have labels for your data points you don’t need the axis as well. In fact it can become a nuisance to try to fit everything in one chart and still use both axis labels and data point labels
| Axis Labels and Data Point Labels | Axis Labels Only |
 |
 |
2. Choose the right colors.
With access to so many different color palettes it’s important to choose the right colors that are not only pleasing to look at but also help convey the right message.
- Don’t use too many colors. Some say it’s best to use 3-5 colors on any one dashboard. This is to avoid eye strain and overwhelming your user. Pick a main color and then 2-3 accent colors. These colors can be based on your brand, industry, or just what stylistically you prefer. If you definitely need more than a handful of colors, remember to play with gradients of the main and accent colors you?ve already chosen to see if that makes a difference before adding another color to the palette.
- Be mindful of ‘Traffic Light? colors. For most people red means ?bad? and green means ?good.? It’s okay to use these colors in your design, of course, just try to use them in a way users expect so as not to confuse them.
- Be consistent. If there are matching items within multiple charts in the dashboard use the same color to identify them when applicable. Also be consistent with color usage across all dashbaords. If you have a team of users creating dashboards and you are all creating based on your stylistic preferences, your users are going to suffer. Come together as a team and decide on not only colors but also fonts, and make sure that the design is consistent for everyone.
3. Just because you can doesn’t mean you should.
- Beware of Shiny Objects. There are a lot of cool visualization tools and add-ins out there. Sometimes you may want to use the ‘shiny, new thing? just because it’s shiny and new. While we should definitely strive to learn more about different chart capabilities and features, don’t just go drop what you may think as a cool-looking chart in your dashboard just so you can check the box and say you used it. Different chart types help convey different messages than others. So while it may be tempting to add something new in, make sure you fully understand how it’s supposed to be used first. And while a dashboard is meant to be visual sometimes adding in a regular old table with the data is the best way to go.
- Less is more. We could add 20 charts to one dashboard if we wanted to. It would sure make our lives easier to maintain just one dashboard versus maintaining multiple tabs or multiple dashboards. But doing that won’t making it any easier on your user. Make sure you’re designing your dashboard with room to breathe between charts and other elements. If you’re trying to draw attention to everything, you end up drawing attention to nothing.
- If you really have that much data that needs to be conveyed, think about breaking it up into smaller chunks going from high-level to detailed-level. I?ve often been confronted with having to create a dashboard to satisfy the C-Suite with a broad overview but also satisfy the team members who want a more detailed view. With most data visualization tools this can be accomplished using multiple tabs for the detailed information as well as utilizing filters/slicers when applicable.
Bonus Tip: The Golden Rule of Content Dashboard design is to design with your audience in mind.
Think of how people in general digest information and design for that, not against it. People usually like to consume information from broader to more detailed starting from top to bottom and left to right. If you’re constantly in a battle to explain the data in a dashboard and fielding questions you may need to rethink some of your design.